Design or sizing mechanical components for automated designs is most effective with an understanding of motion controllers. That’s because limited controller understanding limits opportunities to optimize automated design cost performance.
By Boaz Eidelberg, Ph.D., President | Optinet Inc.
Most mechanical engineers aren’t familiar with servo control. That’s because servo control is mainly associated with electrical engineering — and mechanical engineers are mostly tied up with CAD work. But they may be involved in the design of high-performance servo-controlled systems in which mechanical parameters (such as stiffness, mass, and damping) are interchangeable with proportional, integral and derivative parameters of a PID controller. So, the design or sizing of mechanical components for automated setups should be done with good understanding of the motion controller and its associated filters. That’s because without controller insight, it’s hard to optimize the cost performance of automated systems.
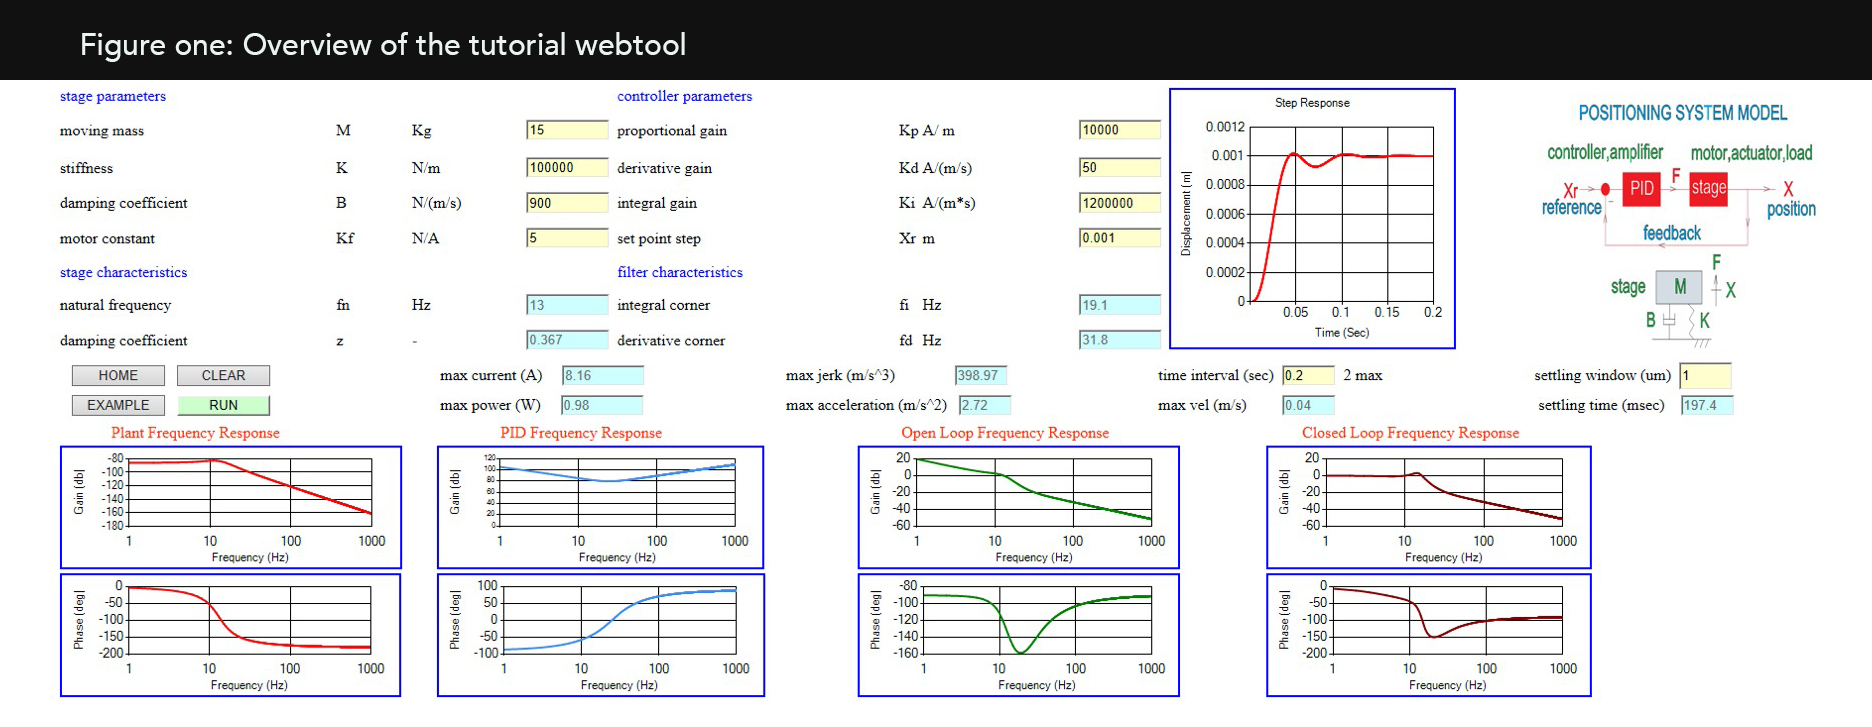
As we’ll explore, one tutorial webtool highlights the relationship between key machine and controller parameters, as well as basic servo definitions and the process of optimizing machine performance and stability. The tool interface is shown in Figure one: Overview of the tutorial webtool. Based on a simple positioning system model, it lets users change both PID and mechanical parameters of the model and observe their effects on system performance.
Relationship of servo parameters and mechanical phenomena
PID servo parameters and mechanical design parameters of high-performance automation tools are closely related. It’s best to analyze overall system cost performance through accounting for both as early as possible in development. As we’ll explore, one self-study webtool can demonstrate the effects of both servo and mechanical parameters of a typical positioning system on its dynamic performance and stability. The tool we demonstrate lets users select stage parameters that characterize the actual plant — and then use iterative strategies to select an optimal set of PID parameters to maximize overall system performance for robust, safe, and stable operation.
Block diagram and system modeling
The block diagram of the model as shown in Figure two: Block diagram of the model represents a simplified closed-loop servo system of a positioning stage. It includes a PID controller, a stage (plant), feedback loop, reference position command, Xr, and actual stage position X.
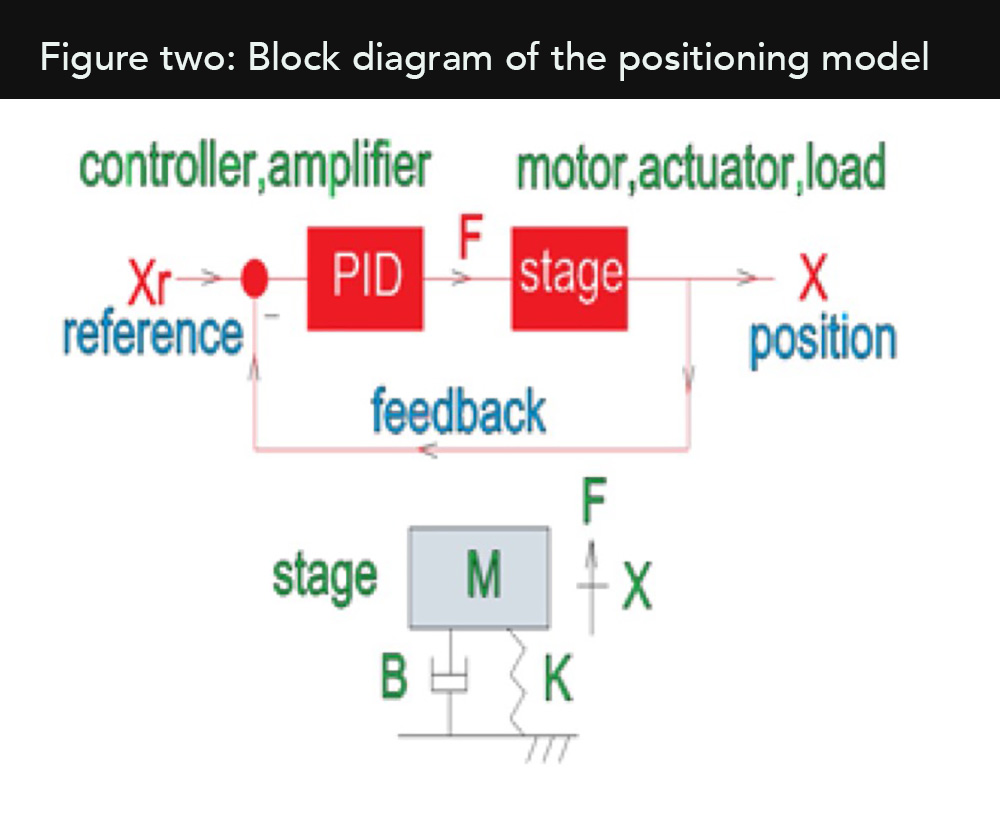
X is sensed by an encoder or by any other positioning feedback device. The stage model (as shown in the figure’s block diagram) is represented by simple mass, spring, and damper parameters — M, K, and B respectively. They are the most influential mechanical parameters on the dynamic performance of most positioning systems.
As shown in figure two, a driving motor force F acts on the stage block as an input and results in the actual stage position X as an output. Similarly, position error E = Xr – X acts as an input to the controller block and results in the motor force as an output. The time-domain relationship between the output X and the input Xr is given by the following two differential equations:
MA + BV + KX = F(t) for the stage — where A = dV/dt and V = dX/dt
F(t) = Km*(Kp*E +Ki*ʃ Edt+Kd*dE/dt) for the PID controller — where Km is the motor constant and Kp, Ki and Kd are the PID gains.
Transfer functions and phase angles
The explicit relationship between the output X and input Xr of the closed-loop servo system requires simultaneous solution of the two differential equations. The solution is simplified from differential equations in time domain (t) to algebraic equations in frequency domain (s) by using their Laplace transform. The Laplace transform H(s) of our closed-loop transfer function is represented: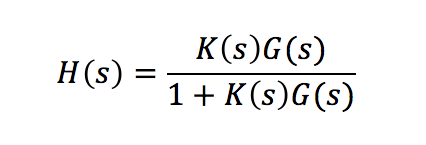
Where K(s) = PID transfer function; G(s) = Plant transfer function; and H(s) = Complex number as a function of frequency (s) with both magnitude (gain) and phase angle (Ph).
Gain is often measured in dB= 20*Log10(gain).
The phase of output X with respect to input Xr is measured in degrees. A phase of 0˚ means that actual position X is in phase with the reference position Xr. At the same time, it is 180˚ out of phase when it feeds back into the controller with a minus sign (-) as shown in the block diagram of Figure two: Block diagram of the model.
Similarly, a -180˚ phase lag means that the output signal feeds back into the controller with a -360˚ phase shift. That makes it a positive feedback inside the controller and a source for possible instability of the closed-loop servo system.
Plant frequency response and stability of closed-loop servo systems
When we RUN the webtool after clicking EXAMPLE, the results in the blue boxes (below the stage parameters) show two important stage characteristics of any automation system — the lowest natural (resonance) frequency and the damping coefficient. High performance machines are typically designed for high stiffness K and low moving mass M to get the highest value for the lowest natural frequency.
The frequency response (Bode plot) of the stage is shown in Figure three: Frequency response of the stage (plant).
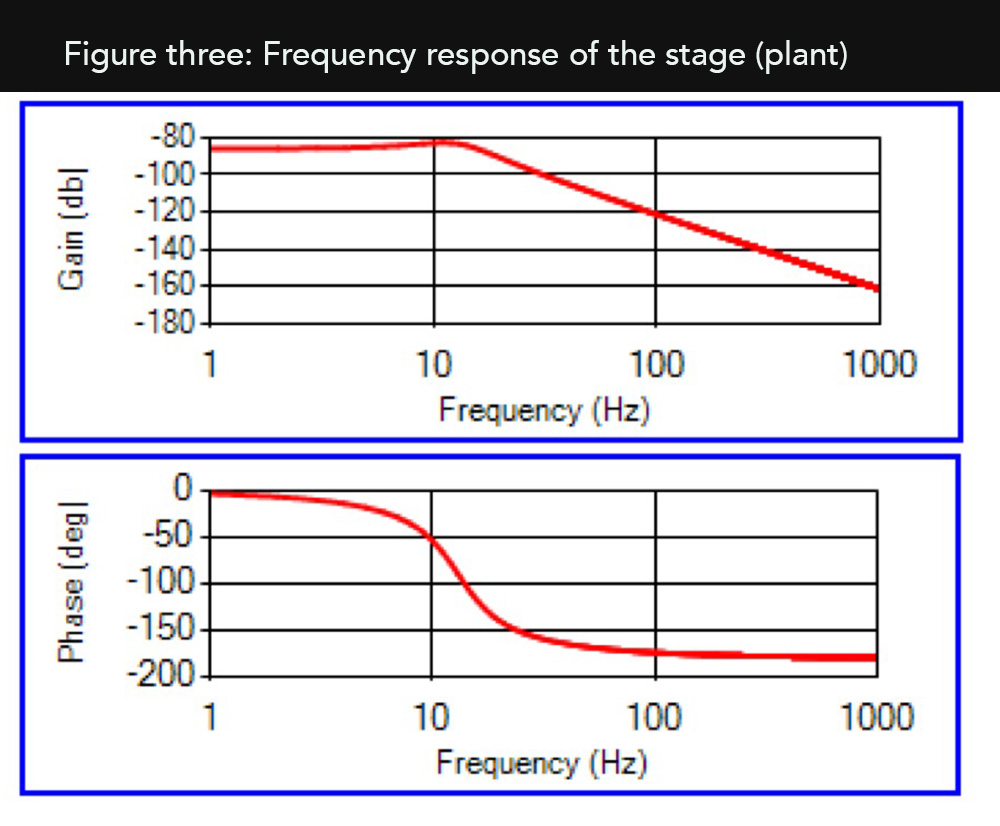 In this figure, we see that the gain has an approximately constant value all the way up to the natural frequency. At the natural frequency, the gain increases with a peak bounded by the magnitude of the damping coefficient. Then with increasing input frequency, the gain drops at a rate of 40 dB/decade, where a decade is defined as the ratio of two frequencies which is equal to 10.
Similarly, the phase starts at zero degrees in low frequencies. It then reaches -90˚ lag at the natural frequency and ends up at -180˚ phase lag at very high frequencies.
It should be noted that real dynamic systems have multiple natural frequencies and usually multiple axes. But the single-axis model in this webtool is a good performance estimator of most positioning systems. Optimal choices for the simple model have mass, stiffness, and damping parameters that yield the lowest natural frequency and damping coefficient of the more complex system. These two-system characteristics are easily measured for any complex system by an impact test and an accelerometer that traces settling time decay.
PID controller frequency response
Many control systems have (in addition to a position-feedback loop) inner velocity and current feedback loops. Yet they all share the same basic closed-loop transfer function H(s) as shown in figure three. The difference is in the complexity of their H(s) expression and the numbers of Zeros and Poles, with which the controller filters are shaped. A Zero is a frequency at which the gain becomes zero, and a Pole is the frequency at which the gain goes to infinity. Although these complex filters are beyond the scope of this tool, the PID as used in our model is considered a classic filter, which is used in many controllers. It is simple (having only one pole and two zeros), relatively easy to understand, and a good one with which to start training for an intuitive understanding of servo-system performance.
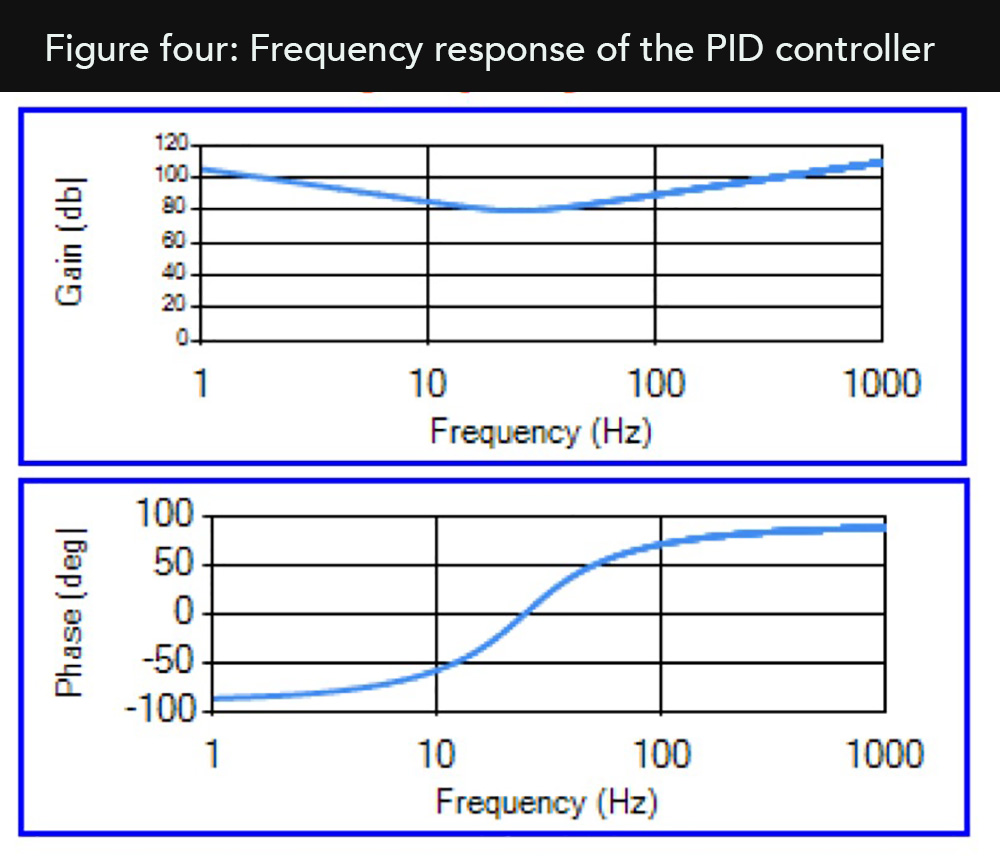
When we click RUN, the corner-points results of the integral and derivative gains appear in the blue boxes below the yellow PID parameters. Corner points are the frequencies where the integral gain and the derivative gain cross the proportional gain. Together they define the shape of a trough, as shown in Figure four: Frequency response of the PID controller.
Looking at the gain of the PID frequency response in Figure four: Frequency response of the PID controller, we see that the integral contribution on the left side of the trough amplifies the error signal at low frequencies and attenuates it at high frequencies. The derivative on the right side amplifies the high frequencies and attenuates the low frequencies. The proportional gain (in between the two corner frequencies) defines the bottom of the trough.
So if we want to reshape the trough and move, for example, the corner point of the integral gain to the left, we will decrease the integral gain. If, on the other hand, we like to move the corner point of the derivative gain to the right, we decrease the derivative gain and vice versa. Similarly, if we want to raise the bottom of the trough, we increase proportional gain … and if we want to raise the entire trough we increase the motor constant.
Looking at the phase diagram of the PID as shown in figure four, we see that starting at low frequencies the integral gain adds a lag of 90˚ (-90˚) to the input signal of the controller. Similarly, the derivative gain adds a lead angle of 90˚ — and the proportional gain does not affect the phase, but it may affect the way the lead and lag frequencies connect. The reader may test these trends by making the changes in the webtool and observing the results on the trough position and shape.
In a general machine design, the proportional gain Kp and the motor constant Kf act as mechanical stiffeners K which improve the response time. The derivative gain Kd acts as a mechanical damper B which attenuate high oscillations. The integral gain Ki may act (in some cases) as a mechanical attenuator such as the inertial effect of a moving mass M. However, in positioning systems it is mostly used in overcoming position errors due to friction.
Open-loop frequency response and phase margin
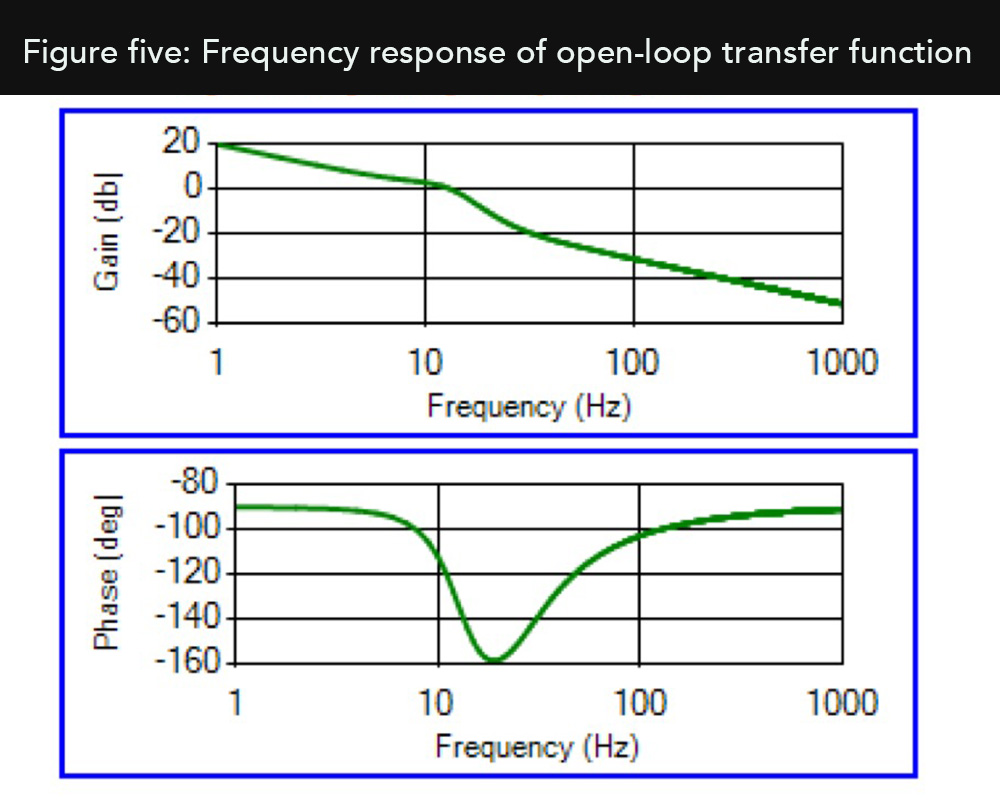
When we multiply the two transfer functions — including the plant G(s) and controller K(s) — we create the open-loop transfer function K(s)G(s) as shown for our EXAMPLE in Figure five: Frequency response of the open-loop transfer function. The open-loop frequency response is an important visual aid for phase margin and gain margin, which are the indicators of system stability.
From the expression of the closed-loop transfer function H(s) we see that when the open-loop transfer function K(s)G(s)= -1 (meaning output signal X is a mirror image of the reference signal Xr) the denominator of H(s) becomes zero and the gain of the closed-loop transfer function goes to infinity … and makes the system unstable. The physical meaning of this expression is that when an output signal X has a -180˚ phase angle with respect to the reference position Xr — meaning that it is a mirror image of the input reference signal Xr — it enters the controller with a (-) sign, which adds another 180˚ to it.
The result is a total of -360˚ phase lag that puts the output signal X in phase with the reference signal Xr and therefore act as a positive feedback. This positive feedback tends increase the position error instead of reducing it —potentially making the system unstable. To become unstable, the feedback of actual position X needs to be positive, but it also must be equal or greater than the reference signal Xr with a gain equal or greater than 1. In this unstable condition, the servo controller pumps in external energy to the system that continuously increases the oscillation amplitude of the stage.
If we look at the response to the step input in time domain as shown in Figure six: System response to a step input in time domain, we see an oscillatory yet stable profile. If we then look at the open-loop frequency response, as shown in figure five, we see that the phase angle, which corresponds to a gain of 1 (0 dB), is equal to about -130˚.
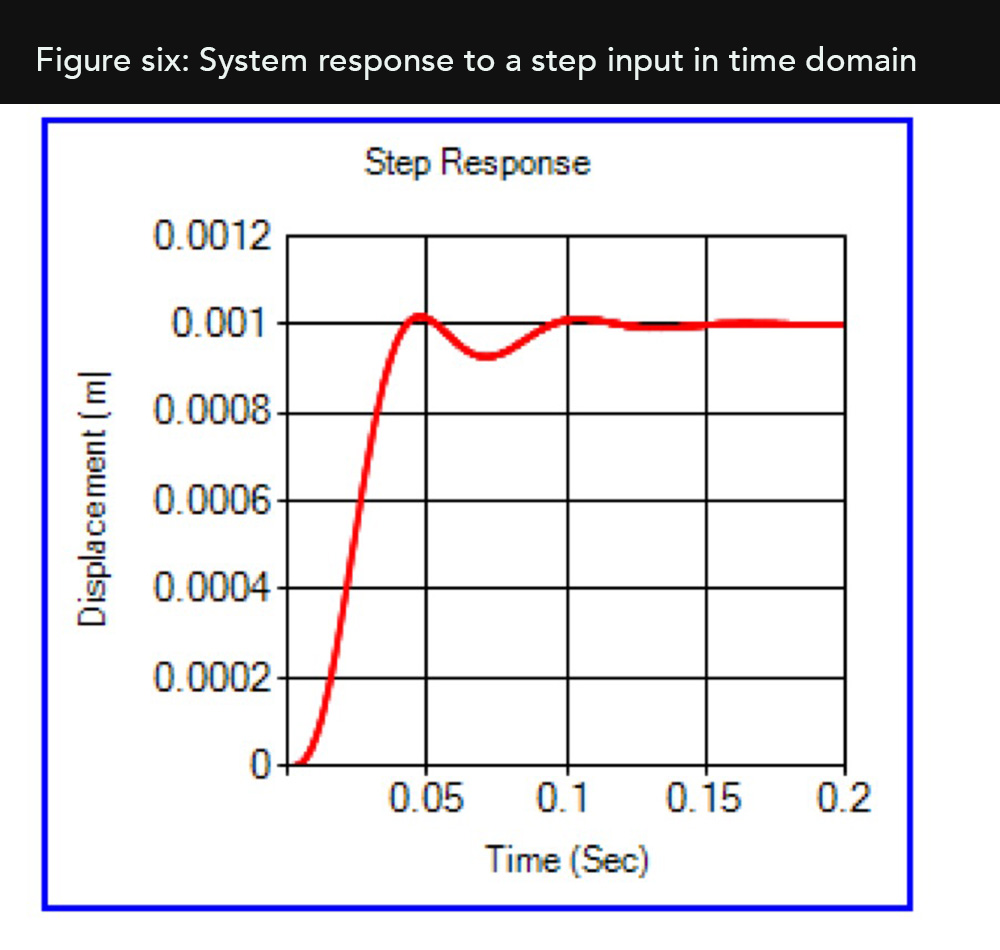
The difference between -130˚ and -180˚, is +50˚. This is a safety margin to stability, which is called Phase Margin. It measures the angle, from the phase at an open-loop gain of 1, to the -180˚ line, which make the system unstable. Servo systems are typically tuned to a phase margin of 30˚ to 40˚.
Bandwidth considerations for design work
Another interesting aspect of the closed-loop transfer function H(s) is that when the open-loop gain K(s)G(s) is very high, the closed-loop system gain is about 1. When the open-loop gain is very low, the closed-loop transfer function resembles the open-loop transfer function. So we may expect that the closed-loop transfer function will be close to 1 until the open-loop transfer function crosses the open-loop line of gain = 1 (0 dB). The frequency at that point is called the position bandwidth.
Consider one example. In the open-loop plot of our EXAMPLE in figure five, position bandwidth is around 10 Hz. So we expect the servo system to drive the stage with a very small position error in all frequencies lower than the bandwidth. Above the bandwidth frequency, the servo system may be incapable of following the input position without error. Similarly, if disturbing forces act on the stage at higher frequencies than the bandwidth, the servo may be incapable of rejecting them, and other means (such as feed-forward loops — beyond the scope of this article) may be required.
Servo tuning example exercise
As a tutorial exercise of our EXAMPLE, let’s try to improve the natural frequency of the stage by increasing its mechanical stiffness K by a factor of 10. (Here, we simply add a zero to the stiffness value and then click RUN.) We see that natural frequency increased (as expected) by a factor of sqrt(10) to 41.1 Hz.
Also notice that the bandwidth dropped from its original value of 10 to about 1 Hz and the settling-time response became sluggish. That’s because when we increase the stiffness by a factor of 10, the stage gain dropped by 20 dB and the crossover frequency of the open-loop transfer function moved to the left. This shift decreased the position bandwidth and slowed down the stage.
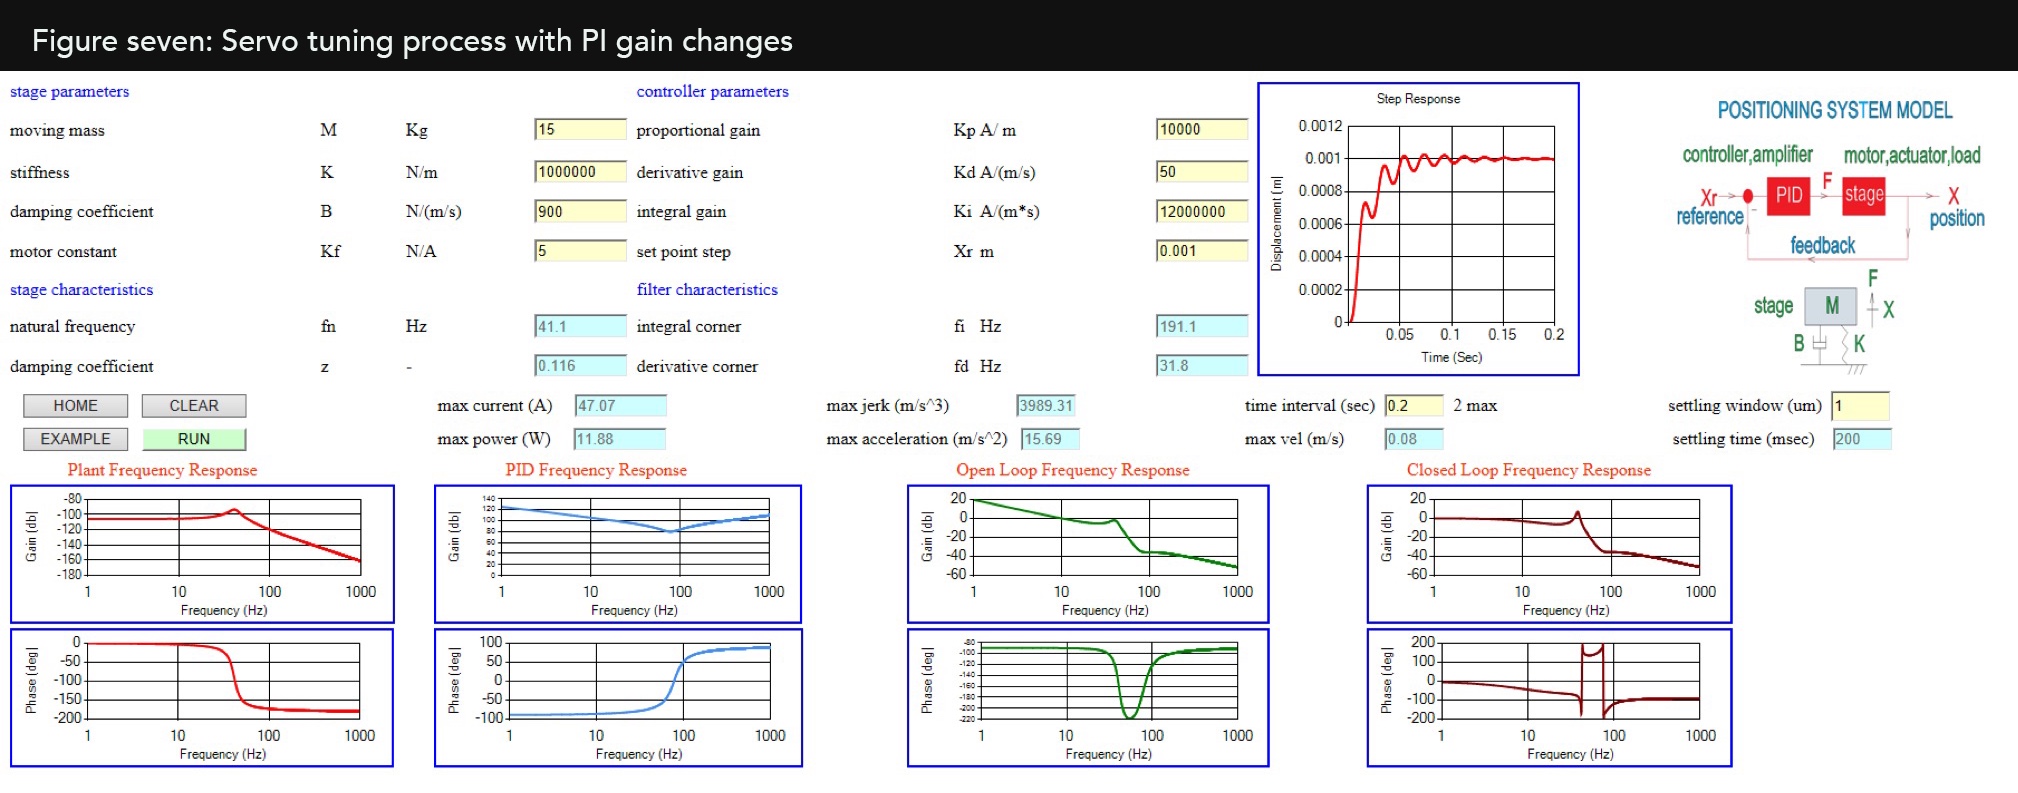
To increase the low-frequency gain (which was lost in the previous iteration) we may try to increase the integral gain Ki by a factor of 10 (by adding a 0 to the integral gain value Ki and clicking RUN). Results in Figure seven: Servo tuning process with PI gain changes show the left side of the trough increased, bandwidth went back to about 10 Hz, and the resulting response became faster yet oscillatory.
Gain margin example exercise
In the last tuning example, we reached a bandwidth of about 10 Hz with a 90˚ phase margin. As mentioned, this is one condition to ensure system stability. Another condition for stability is gain margin — the distance (in dB) between the zero-dB line and the open-loop gain curve at a frequency where the phase is -180˚. Figure eight shows it to be about 15 dB, which occurs at about 80 Hz. The chart in figure eight also shows the phase margin and the bandwidth as discussed earlier.
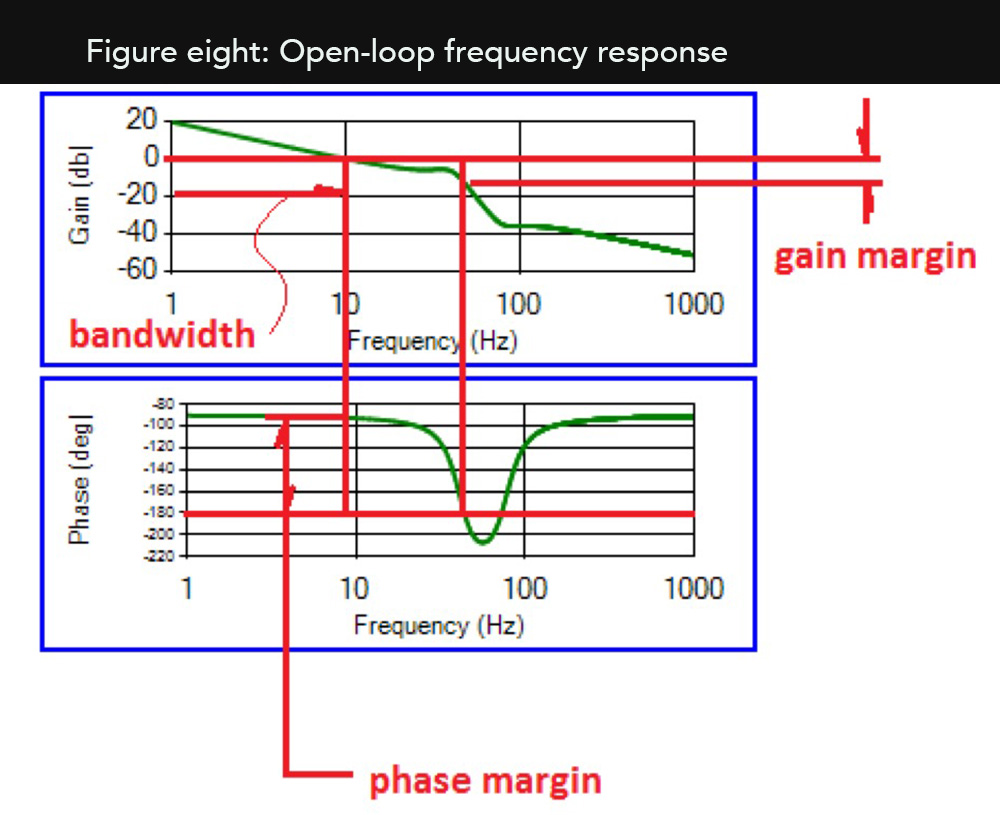
The rationale of the gain-margin requirement for stability is like that of the phase margin. When the phase is -180, we need to ensure that output is lower than the input with a gain magnitude of less than 1. Otherwise, the servo will command the motor to add increasing energy to the system, which increases output indefinitely — and makes the system unstable.
Under such conditions, any small noise (such as RFI, EMI, or small floor vibrations) may run the system unstable. Results may be noticeable as loud audible noise, high vibration, and (at high enough gain and low enough damping) a possible catastrophic failure. Servo systems are typically tuned to gain margins greater than 15 dB.
Mechanical improvements for better design performance
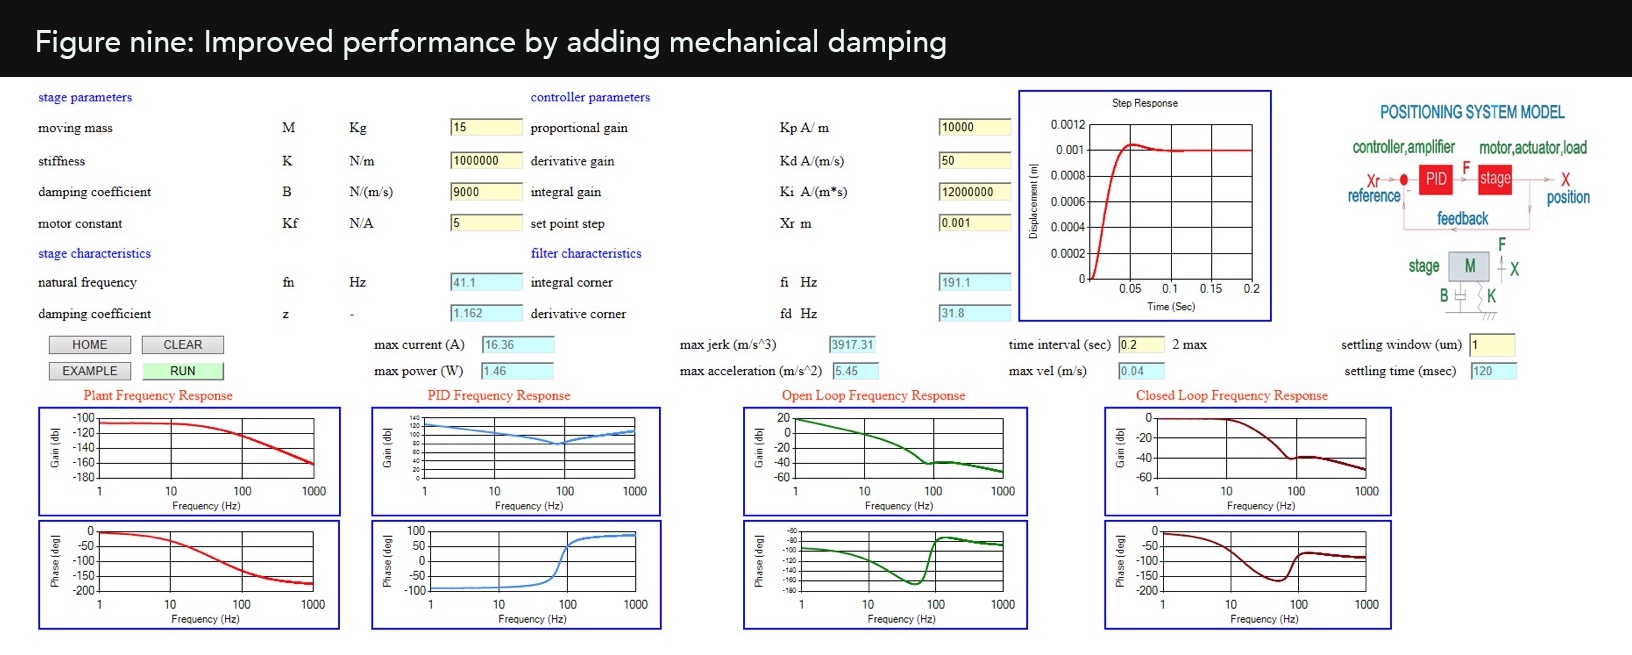
To attenuate the ringing effect as shown in figure seven and shorten the settling time response, we can try to increase the mechanical damping. As shown in figure nine, increasing the mechanical damping B by a factor of 10 gives a smoother motion profile and reduced settling time — from longer than 200 msec in the previous iteration to 120 msec in this one.
System optimization with multiple iterations
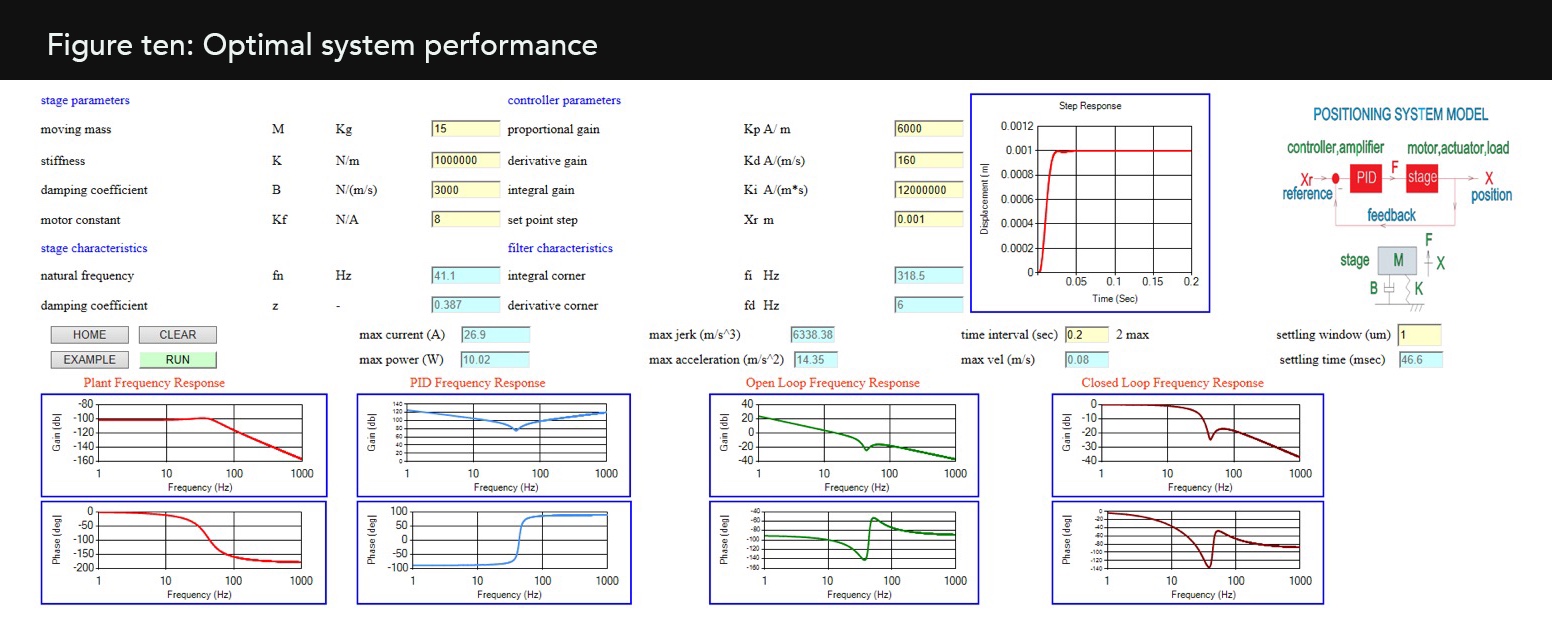
We may continue the iterative process of tuning system parameters for optimal performance by trial and error or by recommended tuning processes. Several widely used tuning techniques involve a PID parameter that is changed until the stage starts ringing. Then, the parameter value is reduced and the next parameter is increased until it resonates the system again. This process continues until the designer gets a good settling profile and the settling time is minimized to an acceptable value. An example of what a good tuning profile may look like in time domain is shown in Figure ten: Optimal system performance. Settling time in this iteration is reduced to 46.6 msec.
Note that the webtool presented in this article is provided as a courtesy of Optinet Inc., but the company doesn’t warrant the tool’s results. It’s the responsibility of the user to validate results by other means — as with comparisons with results from other tools, common sense, third-party expert opinions, or test results with a high-performance motion controller. The webtool is primarily intended as a self-study tutorial of simultaneous effects that PID and mechanical parameters have on the performance and stability of automated mechanical systems.
Optineer Inc. | optineer.com




Leave a Reply
You must be logged in to post a comment.