
For a system driven by sinusoidal inputs, such as a servo motor, frequency response is a measure of the amplitude and phase of the output signal relative to the input signal. It is a useful estimate of the limits of servo tuning that will produce a stable system without oscillation.
To determine frequency response, a sinusoidal input with controlled amplitude is applied to the system. The output will be a sine wave with the same frequency. As the input frequency is increased (with amplitude remaining constant), the amplitude and phase of the output signal are measured and compared to the amplitude and phase of the input.
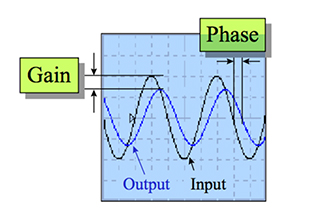
Image credit: Kollmorgen
In an ideal system, where output perfectly tracks input, the output will have the same amplitude (0 dB amplitude gain) as the input and there will be no phase lag (0 degrees) between the input and output signals. This is referred to as a frequency response function (FRF) of 1. But in real-world applications, there is an input frequency at which the output signal cannot keep up, causing the amplitude of the output to diminish and phase lag to increase.
Frequency response and bandwidth
The most common way to represent frequency response is with a Bode plot. Frequency is plotted on the horizontal axis in a logarithmic scale, while amplitude response (also referred to as magnitude response or output gain) at various frequencies is plotted on the left vertical axis in either a linear or logarithmic scale. Phase response at the tested frequencies is plotted in a linear scale on the right vertical axis. (While amplitude response and phase response are often shown on the same graph, their relationship to frequency can also be plotted on separate graphs.)
Bandwidth is typically used as an indicator of how “fast” a system is. In servo tuning, bandwidth is defined as the frequency at which the amplitude response is equal to -3 dB. The -3 dB value is significant because at this point, the output gain is reduced to 70.7% of its maximum value. Also at this point, the output power, or power delivered to the load, is half of the input power.
Amplitude, in decibels, is defined as:
20log10(Av)
Where Av is the output gain (ratio of output to input)
At an amplitude of -3 dB, the output gain equals 70.7% of maximum
-3 dB = 20log10(0.707)
Using the equation for power:
P = V2/R
When R = 1 and V = 70.7% of maximum
P = (0.707)2 / 1 = 0.5
In other words, power equals 50% of input voltage.
Using Bode plots to measure system stability
The phase margin (determined from the gain crossover frequency) is 33 degrees.
Image credit: Motion Engineering
There are two common measures of stability in a servo system. The first, gain margin, measures how much gain can be added to the system before instability occurs. To determine the gain margin, find the point where the phase response crosses -180 degrees, and at that frequency (also known as the phase crossover frequency), find the amplitude response. The amount by which the amplitude response is less than 0 dB is the gain margin.
Phase margin indicates how much delay can be introduced before instability occurs. At a phase of -180 degrees, the output signal is the equal to the input signal, but inverted. This means that the error (which is the difference between output and input) is twice as much as the input, and will continue to increase until the system shuts down. The phase margin is determined by finding the point where the amplitude crosses 0 dB, and at that frequency (also referred to as the gain crossover frequency), find the phase response. The amount by which the phase response differs from -180 degrees is the phase margin.
Feature image credit: Kollmorgen
Leave a Reply
You must be logged in to post a comment.