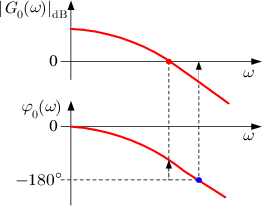
A common method for evaluating a servo system’s stability is to determine the system’s frequency response, which involves measuring the gain margin and phase margin at the crossover frequencies. To understand how gain and phase crossover frequency is used to determine stability, let’s look at exactly what it represents, using a Bode plot.
Closed loop systems are difficult to model due to the interactions between the output signal, the feedback, and the input signal. Modeling the system as open loop instead of closed loop gives a better understanding of how the output will respond to various inputs.
Gain crossover frequency
Gain is a measure of how much the input signal is amplified, or in other words, how hard the system tries to reduce the error between the input and output. The gain margin indicates how much gain can be added to the system before it becomes unstable.
The frequency at which the input and output signals have the same amplitude is found where the amplitude curve crosses the 0 dB line (also referred to as a gain of 1, or unity gain). This frequency is known as the gain crossover frequency.
Phase crossover frequency
In a servo system, there will typically be some difference between the phases of the input and the output signals, and this difference is known as the phase shift. A Bode plot shows the phase shift at various frequencies. The frequency at which the phase curve crosses the -180 degree line is known as the phase crossover frequency. (We’ll see below why the -180 degrees phase shift is significant.)

The gain crossover frequency is identified by the red dot, and the phase crossover frequency is identified by the blue dot.
Image credit: Christian Schmid
Goals of servo motor tuning
In servo control, an output signal that matches the input signal in amplitude and phase (0 dB amplitude gain and 0 degrees phase shift) is referred to as a frequency response function of 1, and means that the servo is perfectly tuned and no corrections are needed. On the other hand, an output signal that has the same amplitude (0 dB gain) but is 180 degrees out of phase with the input signal would result in an error that is twice the size of the input. To avoid this condition, we analyze the gain margin at the phase crossover frequency, and the phase shift at the gain crossover frequency.
A Laplace transform is used to derive the open-loop transfer function of a feedback system, which has a denominator of 1 + G(s)H(s). Instability results when the denominator becomes 0, or when G(s)H(s) equals -1. This occurs when the frequency response is 0 dB, -180 degrees.

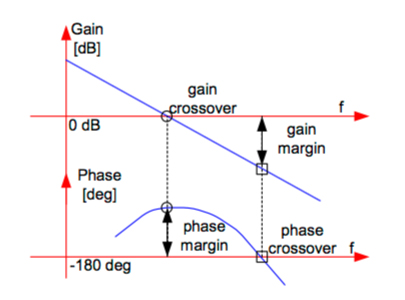
First, we observe the phase crossover frequency. Remember, this is the point where the phase curve crosses the -180 degree line. At this frequency, we analyze the gain curve—specifically, how far is it from the 0 dB point. The amount by which the gain is less than the 0 dB point is known as the gain margin. This is, in effect, the safety margin of how much gain can be added to the system before the condition of 0 dB, -180 degrees is reached and the system becomes unstable.
Next, we look at the gain crossover frequency, which is the point where the amplitude curve crosses the 0 dB line. At this frequency, we observe how far the phase curve is from the -180 degree line. This is known as the phase margin. Like the gain margin, the phase margin tells us how much additional phase shift can occur before the 0 dB, -180 degree condition is reached and the system becomes unstable.

Phase margin is determined at the gain crossover frequency.
Image credit: ACS Motion Control
A typical goal of tuning is to maximize the phase margin, since low phase margin is related to overshooting and ringing in the system. Phase margin is maximized by manipulating the gains in the PID (or PI) controller. While the ideal gain and phase margins vary by machine type and application, a rule of thumb is to achieve a gain margin of 10 to 30 dB and a phase margin of 30 to 60 degrees.


Leave a Reply
You must be logged in to post a comment.