
Precision manufacturing and testing processes are highly sensitive to vibrations, which often result from both internal sources such as foot traffic, fans, and pumps, and external ambient sources such as outside traffic, construction, and other nearby industrial activities. To address these concerns, a set of “generic” vibration criteria was created in the 1980s by Eric Ungar and Colin Gordon, providing a guide for designers of vibration-sensitive manufacturing facilities and equipment.
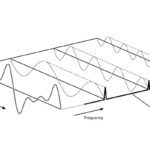
The vibration criteria (VC) are often represented as a velocity spectra in 1/3-octave bands. The original criteria included four levels labeled VC-A through VC-D. In 1994, a fifth level was developed (VC-E) and the vibration criteria were standardized by the IEST (Institute for Environmental Sciences and Technology). Through additional testing and analysis, the criteria have been expanded to now span levels VC-A to VC-M.
A 1/3-octave band is a frequency band that, rather than covering an entire octave, has a width defined by an upper band frequency (f2) that is equal to the lower band frequency (f1) times the cube root of 2: f2 = f1*∛2.
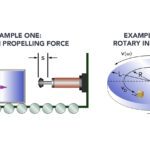
To develop the vibration criteria (VC) curves, vibrations are measured in the vertical and two horizontal directions. Vibration can be expressed as displacement, velocity, or acceleration, but it’s important to note that for the VC curves, the original developers chose to express vibration in terms of root-mean square (RMS) velocity. This is because studies have shown that while different types of equipment exhibit maximum sensitivity to vibration at different frequencies, these points often lie on a curve of constant velocity.
The vibration criteria (VC) curves also use a proportional bandwidth — in other words, bandwidth is proportional to frequency — rather than a fixed bandwidth. The proportional bandwidth was chosen because experience demonstrates that in most environments, vibration is dominated by broadband, or random, energy rather than tonal, or periodic energy. With a proportional bandwidth, the center frequencies of the individual bands are standardized, and the bandwidth of each band is 23 percent of its center frequency.
Often depicted with the vibration criteria (VC) curves are the four ISO guidelines related to the effects of vibration on people in various types of buildings or environments. And some vibration charts also depict the NIST-A criterion — originally developed for metrology applications — alongside the VC curves.
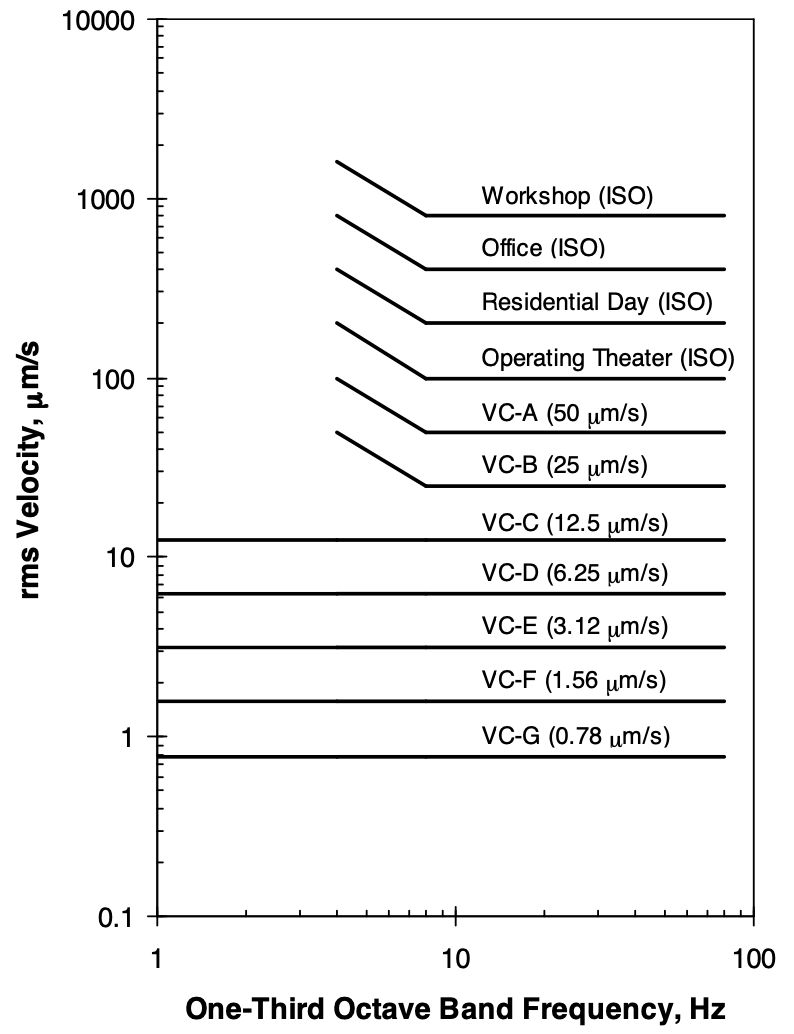
In conjunction with the vibration criteria (VC) curves, a table was developed to define the maximum level, or amplitude, for each criterium and to describe how and where each criterium is deemed to be most applicable. For example, the VC-C criterium allows an amplitude of 12.5 μm/s and is deemed to be appropriate for “optical microscopes to 1000X, inspection and lithography inspection equipment (including moderately sensitive electron microscopes) to 1 μm detail size, and TFT-LCD stepper/scanner processes.”
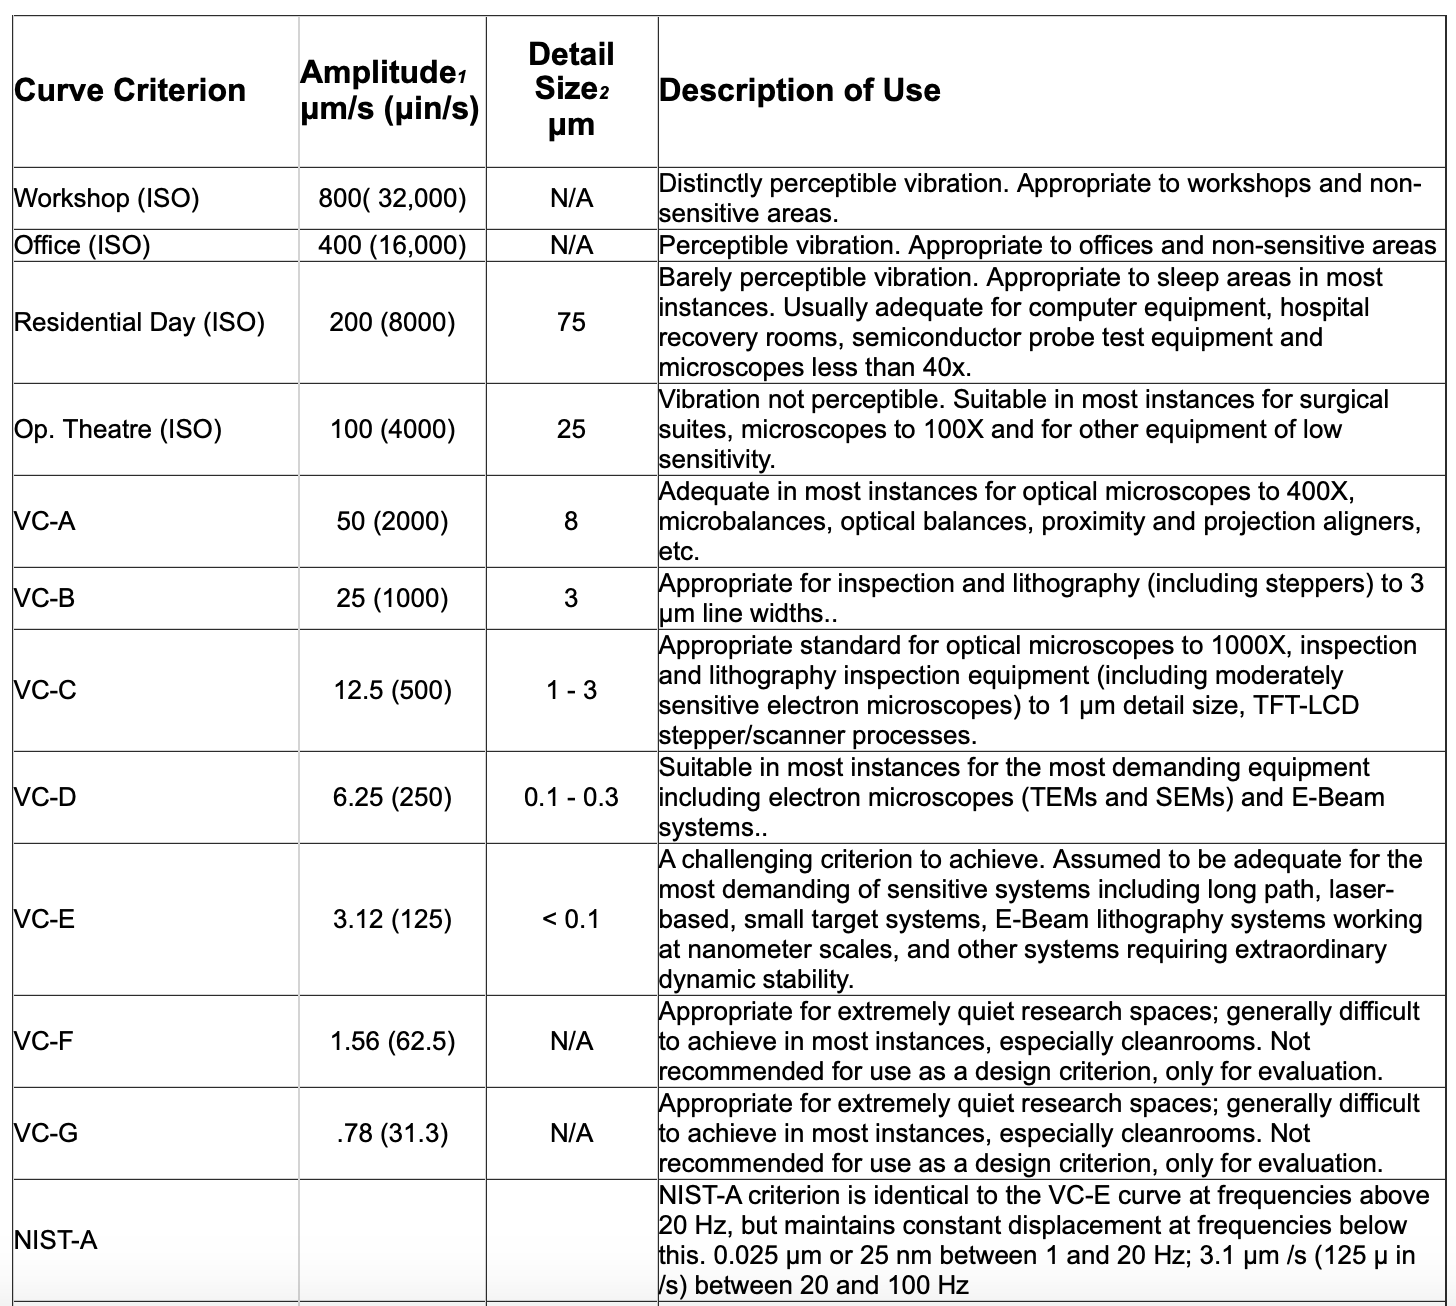
The table often includes a specification labeled “detail size.” According to the original developers, this refers to the “line width in the case of microelectronics fabrication, the particle (cell) size in the case of medical and pharmaceutical research, etc.” — another indication of the VC curves’ original focus on the microelectronics, medical, and biopharmaceutical industries.
Despite being developed with these three industries’ needs in minds, the vibration criteria have now been accepted and adopted by many industries that use vibration-sensitive equipment, as the basis for designing facilities, mounts, and vibration-dampening systems to meet required vibration levels.
Leave a Reply
You must be logged in to post a comment.